The Dashboard is the first page that you see upon logging in or signing up with CartGenie. It contains an overview of your store’s orders, sales revenue, most purchased products, and more.
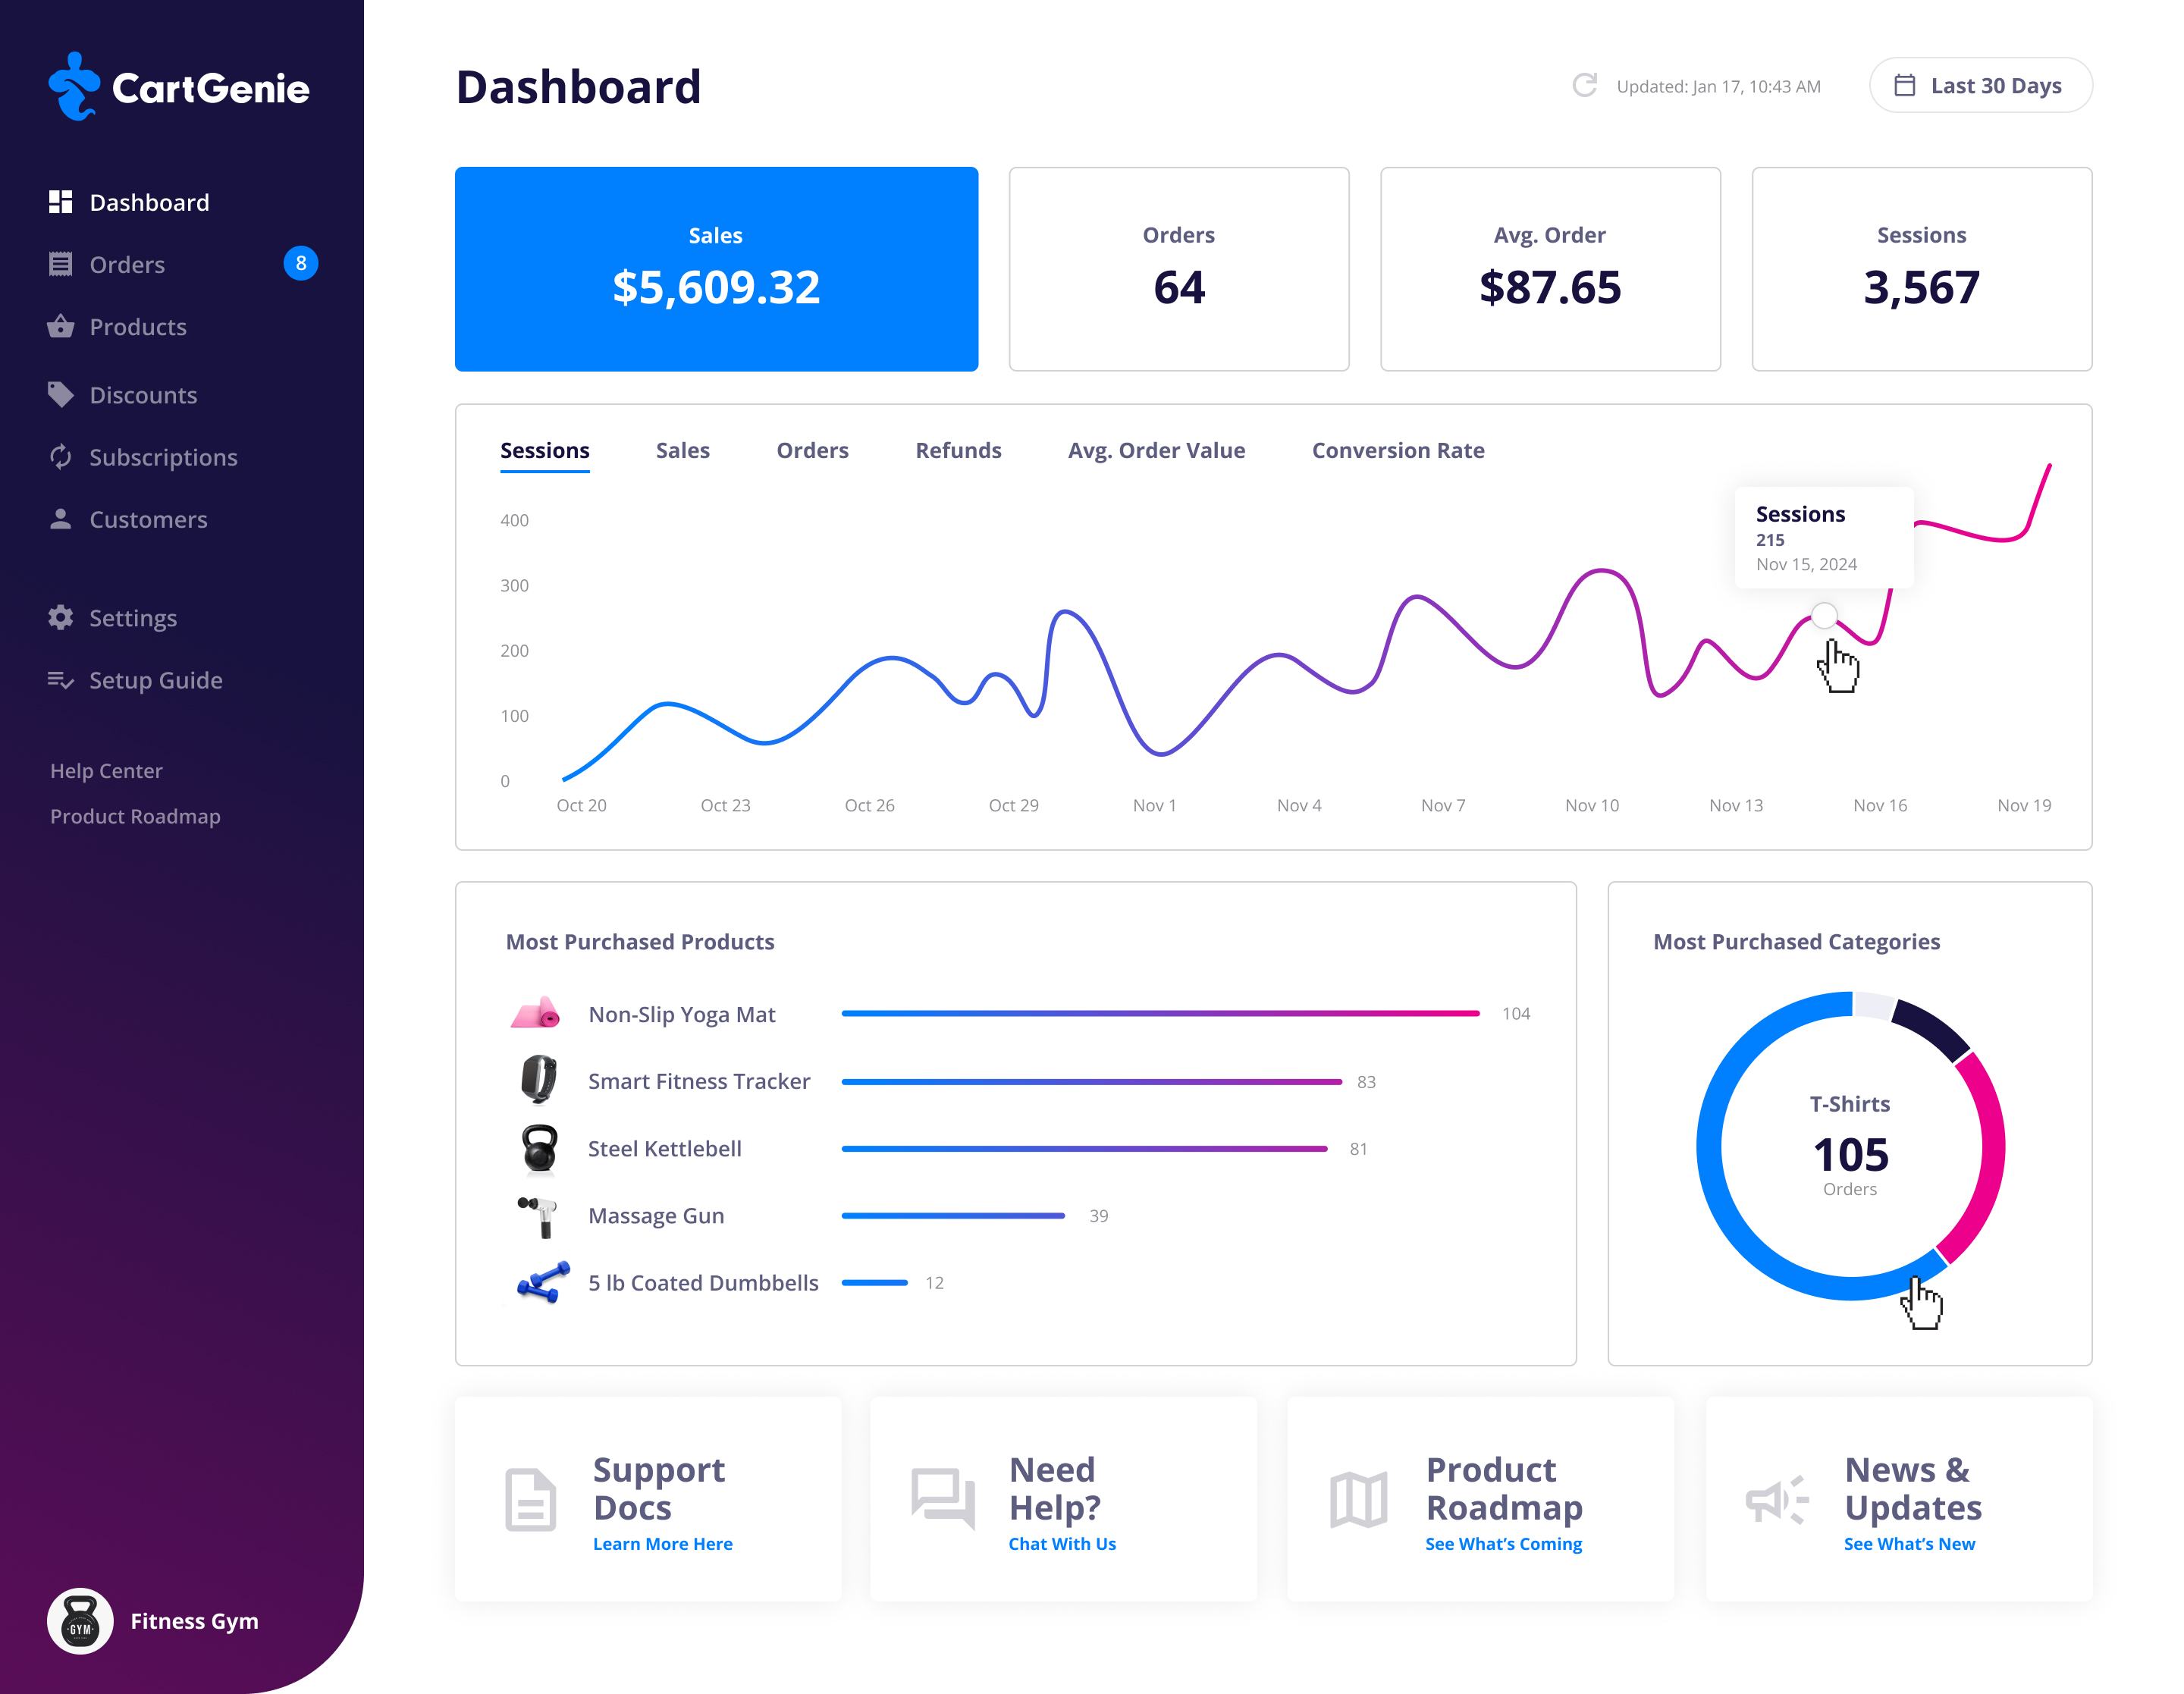
By default, the page shows your metrics for the last 30 days, but you can different periods (or any custom date range) by clicking the calendar button in the top right.
Your dashboard will update periodically (you can see the last updated date in the top right). But if you need to update to see the most recent information, you can click the refresh icon to pull new data.

You can see a chart of your sales revenue, quantity of orders, refunds, average order value, and conversion rate by clicking the tabs at the top of the cart. Hovering over this line graph will give you more detailed information.
Below it you’ll see a bar chart of the most purchased products from your store in the selected time period as well as a pie chart of the most purchased product categories.